
eCommerce KPIs: Sales Management and Control
Learn How to Use eCommerce KPIs: Sales Management and Control.
As a CMO, you know measuring key performance indicators (KPIs) when managing an eCommerce business is essential.
How do you determine what’s working and what’s not? You can start by focusing on the relevant KPIs that accurately reflect how well your business is doing from both customer service and financial standpoints.
Knowing which metrics to look at is crucial for developing strategies that boost sales, attract customers, and increase overall profits.
This blog post will discuss some of the most important eCommerce KPIs every CMO should watch to ensure their ongoing success.
What is a KPI?
KPIs (Key Performance Indicators) are measurable values that help organizations track and assess the performance of their operations.
They indicate whether goals are being achieved and what areas may need improvement. KPIs can be used to evaluate both short-term objectives and long-term strategies.
By monitoring KPI data regularly, businesses can identify opportunities for growth and make changes to maximize production or enhance service delivery. Examples of measures commonly used as KPIs in business include customer satisfaction ratings, sales figures, website traffic, marketing KPIs, employee turnover rates, production output levels, etc.
Tracking these metrics regularly makes it possible to get an accurate picture of where a company stands and what needs to be done to ensure continued success.
KPIs can be used by all departments in a company, helping to align strategy and operations across the entire organization.
A well-defined KPI strategy can help organizations measure success, identify areas of improvement, and make important decisions that drive long-term growth. It is essential for businesses to regularly review their KPIs to ensure they are accurate, relevant, and up-to-date to maximize their effectiveness as tools for performance evaluation.
Why are e-commerce KPIs important?
E-commerce KPIs are essential for any company that engages in online sales. These metrics provide organizations with valuable insights into the success of their digital activities, including customer experience, website traffic, and sales performance.
With the help of e-commerce KPIs, businesses can analyze trends, identify areas for improvement and optimize their strategies to maximize revenue.
KPIs enable organizations to measure progress toward goals and track the impact of different marketing campaigns on consumer behavior.
E-commerce KPIs also make it easier to spot shifts in customer preferences or changes in industry trends which could help inform future decisions and strategies. By monitoring these metrics regularly, businesses can get a clearer view of their performance relative to competitors in their market.
What industries should be using e-commerce KPIs?

E-commerce KPIs apply to virtually any digital sales industry, including software apps, retail ecommerce KPIs, hospitality, travel, and leisure.
Tracking these metrics can help companies understand customer preferences and purchasing behavior, enabling them to make better decisions about how to market their products or services. It also provides valuable insights into the effectiveness of marketing campaigns and helps organizations identify growth opportunities.
By monitoring e-commerce KPIs regularly, businesses of all sizes can optimize their strategies to increase revenue and customer satisfaction while staying ahead of the competition in their market.
Regardless of the industry, businesses must have a well-defined KPI strategy regularly monitored and evaluated. Through this process, organizations can stay on top of their performance and make the necessary changes to ensure long-term success.
The importance of KPIs continues to grow in today’s digital world, making them essential tools for business success. Monitoring e-commerce KPIs regularly is an effective way to ensure businesses remain competitive in an ever-changing market.
By monitoring these metrics regularly, businesses can understand customer preferences and purchasing behavior, which is critical for any successful online sales strategy.
They provide valuable insights into marketing campaigns’ performance and help identify areas where improvements can be made, or new opportunities exist.
Data collected from e-commerce KPIs allows companies to compare their performance against competitors and make informed decisions that drive long-term growth.
E-commerce KPIs are key indicators of success for any business engaging in online sales.
They provide invaluable insights into customer preferences, behavior, and marketing campaigns that can be used to optimize strategies and maximize revenue.
Regularly tracking these metrics will help businesses stay ahead of the competition and ensure long-term success. Let’s dig into the ecommerce KPIs list and the best ecommerce KPIs for success.
Conversion Rate – measure the success of each marketing campaign.
In today’s highly competitive business environment, effectively measuring the success of each marketing campaign is crucial to strategic decision-making processes. One essential metric businesses rely on is the conversion rate, an invaluable tool to gauge the overall performance and return on investment for marketing efforts.
By diligently monitoring and analyzing conversion rate data, businesses can identify the strengths and weaknesses of every campaign, enabling them to make more informed decisions on resource allocation and future strategies.
This ultimately leads to long-term success and a sustained competitive advantage, as companies can continually refine and optimize their marketing efforts – ensuring that every campaign operates at peak efficiency and significantly contributes to achieving organizational goals.
Average Order Value (AOV) – track the average dollar spent per purchase.
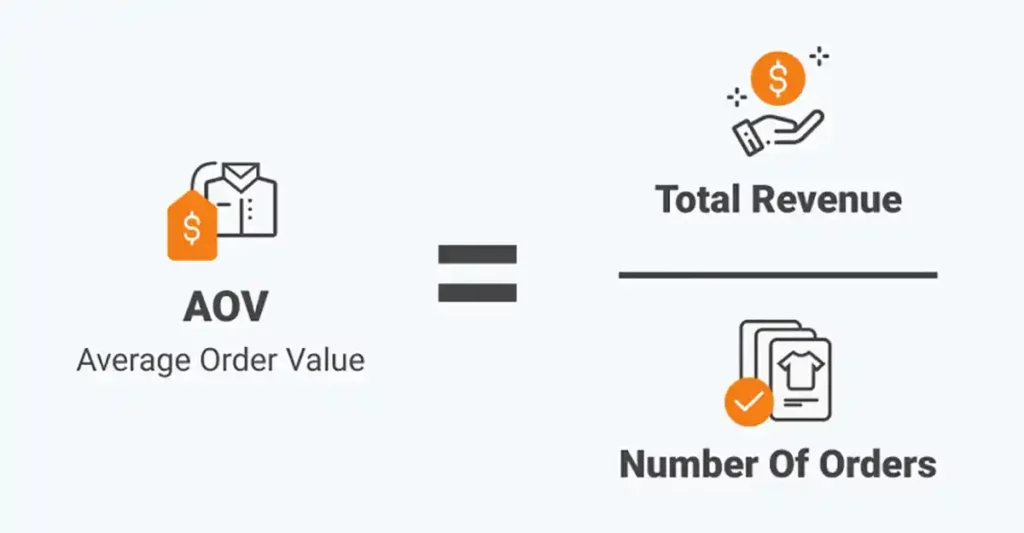
Understanding and tracking the Average Order Value (AOV) is essential for businesses aiming to maximize their revenue and growth opportunities.
Companies can gain valuable insights into their customers’ purchasing behavior, preferences, and overall satisfaction levels by evaluating the average dollar amount spent per purchase.
This knowledge can then be leveraged to optimize marketing strategies, implement effective promotions, and adjust product offerings to better cater to customers’ needs.
Ultimately, a close focus on AOV can enable businesses to make data-driven decisions that improve profitability and foster customer loyalty and long-term success in the market.
Customer Acquisition Cost (CAC) – Monitor the cost of acquiring new customers
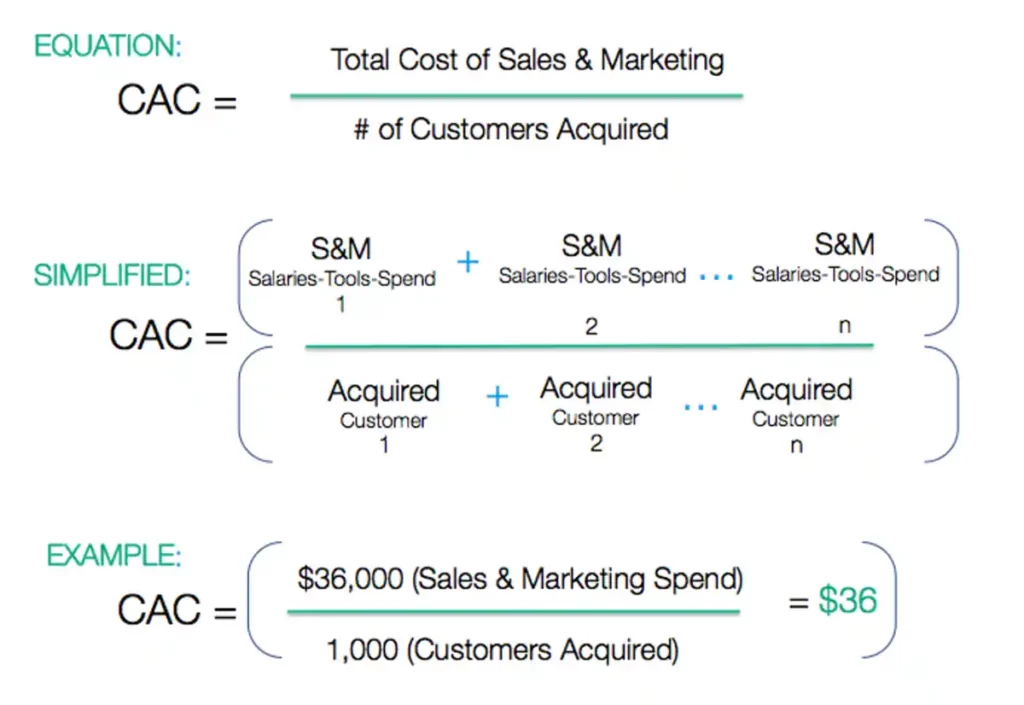
Consistent Customer Acquisition Cost (CAC) monitoring is vital to sustainable growth and profitability. This metric provides valuable insights into the financial efficiency of marketing and sales strategies used to attract new customers.
By diligently tracking CAC, companies can identify areas for improvement, adjust their tactics accordingly, and ultimately derive better returns on their investment.
A deeper understanding of CAC empowers businesses to make informed decisions about customer prioritization and overall spending, allowing them to optimize the allocation of their resources.
In a competitive market, staying on top of customer acquisition costs is not merely a strategic advantage but a necessity to thrive and succeed in the long run.
Repeat Customer Rate – Measure how often customers return to purchase from your store again.

In today’s competitive business landscape, repeat customer rate has become an increasingly crucial metric for the enduring growth of your enterprise.
This measurement evaluates how often patrons choose to make a second, third, or even fourth purchase from your store, demonstrating their loyalty and overall satisfaction with their shopping experiences.
By closely monitoring and analyzing the repeat customer rate, you gain valuable insights into their preferences while receiving a lifetime value assessment of your clientele that can be harnessed to optimize marketing strategies, enhance customer service, and ultimately foster long-term associations.
Furthermore, fostering a positive relationship with your repeat customers aids in generating vital word-of-mouth marketing, helping to establish your store as a trusted and preferred destination in a crowded retail marketplace.
Shopping Cart Abandonment Rates – Track shoppers who add items to their cart but don’t complete the checkout
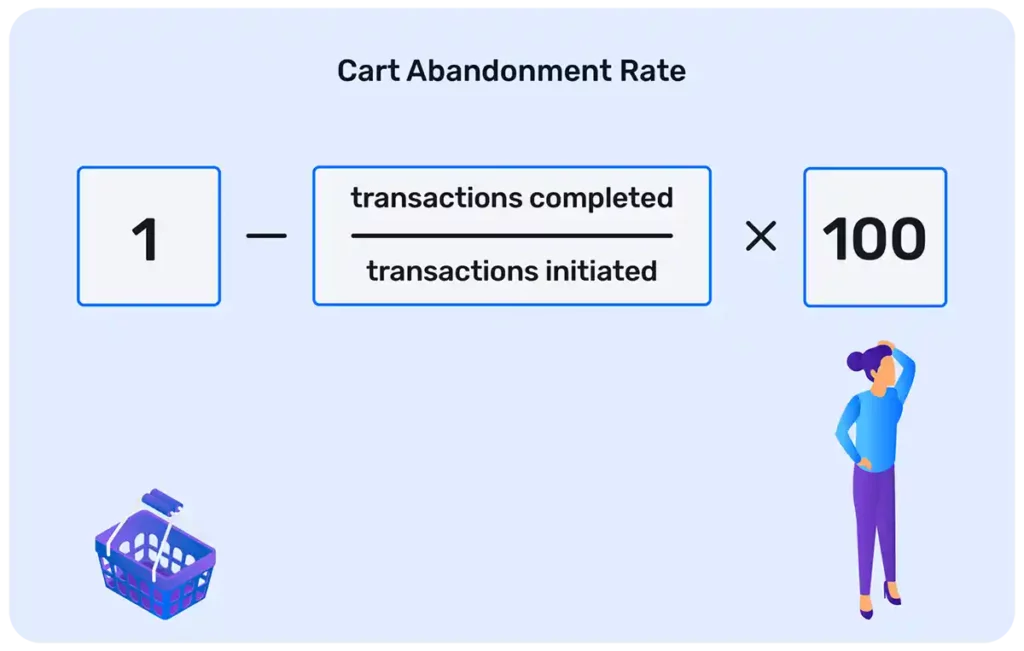
As the growth of e-commerce continues to flourish, businesses must actively address the issue of shopping cart abandonment rates to maximize conversions and customer satisfaction.
By tracking shoppers who add items to their carts but still need to complete the checkout process, online retailers can gain invaluable insights into the cause of this problem and develop effective strategies to encourage follow-through.
Optimizing the checkout process through methods such as simplifying navigation, offering multiple payment options, and addressing customer concerns, can greatly reduce the rate of cart abandonment and increase overall revenue.
In this data-driven age, businesses must harness the power of analytics and meticulously monitor their shopping cart abandonment rates to stay ahead of the competition and create lasting connections with their customers.
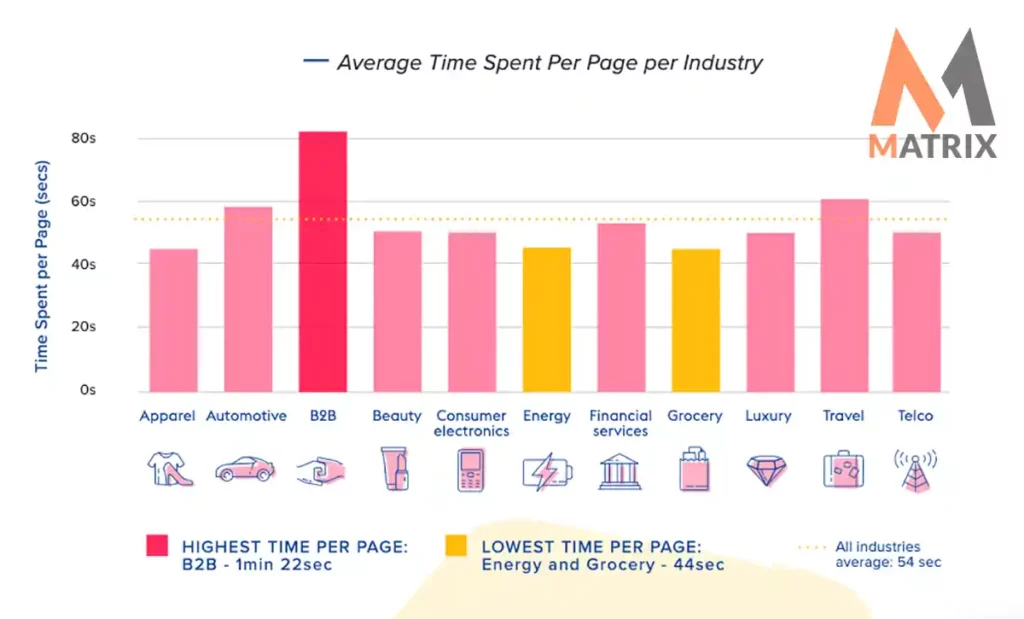
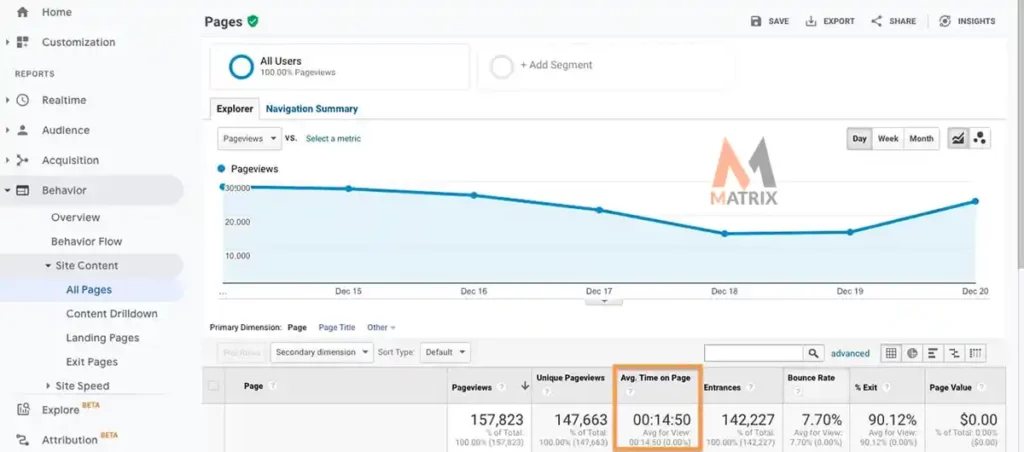
Time on Site or Page – Monitor how long customers spend browsing your website
Understanding the time customers spend browsing your website is crucial in gauging their interest, satisfaction, and engagement level.
By closely monitoring this metric, you can glean valuable insights into which aspects of your site resonate with users and where improvements can be made.
Implementing time on-site or page analysis allows you to assess the effectiveness of your website’s content and overall design, strategize ways to increase customer retention, and maximize the return on your digital marketing investment.
In today’s highly competitive online landscape, businesses must diligently refine their websites and provide a compelling experience that captures visitors’ attention and entices them to explore further.
Bounce rates
Bounce rates play a crucial role in understanding website performance and visitor engagement, as they reflect the percentage of users who leave a website after viewing only a single page.
A high bounce rate can be a red flag, particularly for businesses and content creators, indicating that a site might need to meet visitors’ needs or expectations. Consequently, the analysis of bounce rates is a valuable tool in identifying potential areas for improvement or optimization.
By addressing factors such as page load times, mobile compatibility, and content relevance, businesses, and content creators can work to increase visitor retention and conversion rates, ultimately improving the overall user experience and achieving their desired outcomes.
What are the best website traffic metrics to get more sales?
The best website traffic metrics to get more sales are bounce rate, click-through rate (CTR), page views, organic search visits and time on site. Bounce rate is the percentage of visitors who leave your website after viewing only one page.
Lowering this metric can increase customer engagement and sales. CTR measures how many people click on ads or links leading to your website and can be used to track the effectiveness of marketing campaigns. Page views show the number of pages someone visits on a website, providing insight into customer interest.
Organic search visits measure how many visitors come to your site through organic searches, which can be improved by optimizing content for search engines.
Time on site shows how long people spend viewing your website, which is an important indicator of engagement. Tracking these metrics regularly can help increase sales by providing actionable insights into customer preferences and behavior.
Sales velocity
Sales velocity is a key concept that all sales and marketing professionals should be well-acquainted with, as it dissects the efficiency and productivity of your sales process.
This crucial metric examines the rate at which opportunities are transformed into revenue, enabling you to optimize and accelerate your sales cycle.
By understanding and tracking sales velocity, businesses can make data-driven decisions, highlighting areas requiring improvement and facilitating better resource allocation.
A streamlined sales funnel with a rapid sales velocity results in swifter closure of deals, increased revenue, and, ultimately, a competitive advantage in the marketplace.
Therefore, investing in strategies to optimize sales velocity is a game-changer for organizations aiming for exponential growth and long-term success.
The top 10 e-commerce metrics are:
The Top 10 e-commerce metrics are essential for tracking the performance and success of online stores. These metrics provide invaluable insight into customer behavior and website performance, allowing businesses to make informed decisions about their digital marketing strategies.
- Conversion rate: This metric assesses the percentage of visitors who complete a desired action on your website, such as purchasing or submitting an inquiry form.
- Average order value: This metric measures the average amount customers spend each time they order on your website.
- Cart abandonment rate: This metric tracks the percentage of shoppers who leave without completing their purchase, even though items have been added to their cart.
- Customer lifetime value: Measuring customer lifetime value helps you determine how much revenue to expect from a particular customer throughout your relationship.
- Repeat customer rate: Tracking repeat customers reveals your loyalty programs’ success and provides insight into which marketing channels bring in more repeat business.
- Website traffic: Understanding website traffic allows you to identify the sources of your visitors and assess how effective each is in driving sales.
- Search engine optimization (SEO): SEO metrics help you measure the effectiveness of your efforts to rank higher on search engine result pages, increasing visibility for potential customers.
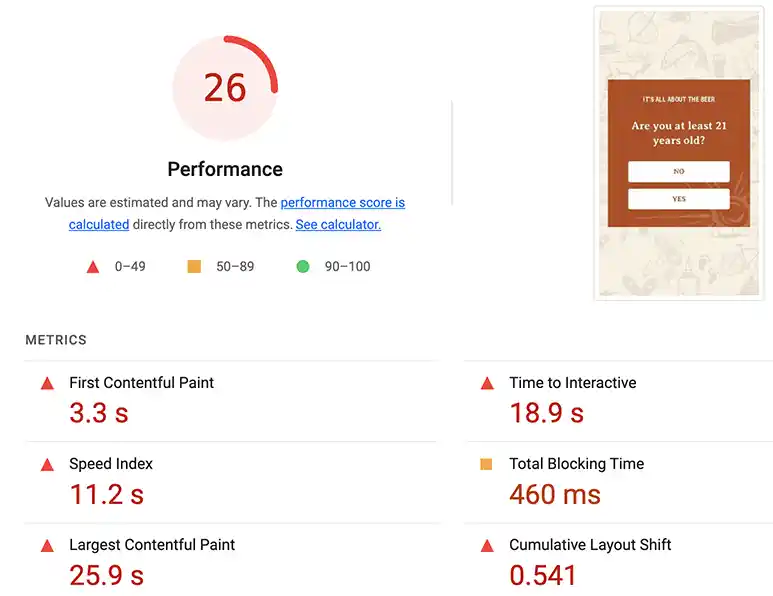
- Page load time: This metric reveals how quickly webpages load, helping you identify and eliminate bottlenecks preventing customers from completing their purchases.
- Mobile compatibility: Tracking mobile performance enables businesses to optimize their website layout and content for better user experience across all devices.
- Content relevance: This metric measures how relevant visitors find your page’s content compared to their search queries, allowing you to tailor content to meet your target market’s needs better.
By understanding and tracking these key e-commerce metrics, businesses can identify their strengths and weaknesses, optimize their digital marketing strategies, and maximize revenue potential. With this valuable data, organizations can make more informed decisions that will help drive success in the long term.
These are just some ways businesses can leverage data to gain a deeper understanding of traffic volume and take actionable steps to improve efficiency, reduce environmental impact, and achieve greater success. By investing in strategies to track essential metrics, organizations can unlock the potential for exponential growth while paving the way for a brighter future.
Examples of important ecommerce metrics and KPIs for sales include:
- Sales: Ecommerce retailers can monitor total sales by the hour, day, week, month, quarter, or year.
- Average order size: Sometimes called the average market basket, the average order size tells you how much a customer typically spends on a single order.
- Gross profit: Calculate this KPI by subtracting the total cost of goods sold from total sales.
- Average margin: Average margin, or average profit margin, is a percentage that represents your profit margin over a period of time.
- Average order value (AOV): The average value of an order from your customers.
- The number of transactions: This is the total number of transactions. Use this KPI with the average order size or total number of site visitors for deeper insights.
- Conversion rate: The conversion rate, also a percentage, is the rate at which users on your ecommerce site convert (or buy). This is calculated by dividing the total number of visitors (to a site, page, category, or selection of pages) by the total number of conversions.
- Shopping cart abandonment rate: The shopping cart abandonment rate tells you how many users are adding products to their shopping cart but not checking out. The lower this number, the better. If your cart abandonment rate is high, there may be too much friction in the checkout process.
- New customer orders versus returning customer orders: This metric compares new and repeat customers. Many business owners focus only on customer acquisition, but customer retention can also drive loyalty, word-of-mouth marketing, and higher-order values.
- Cost of goods sold (COGS): COGS tells you how much you spend to sell a product. This includes manufacturing, employee wages, and overhead costs.
- Total available market relative to a retailer’s market share: Tracking this KPI will tell you how much your business is growing compared to others within your industry.
- Product affinity: This KPIs in ecommerce tell you which products are purchased together. This can and should inform cross-promotion strategies.
- Product relationship: This is which products are viewed consecutively. Again, use this KPI to formulate effective cross-selling tactics.
- Inventory levels: This KPI could tell you how much stock is on hand, how long the product is sitting, how quickly it is selling, etc.
- Competitive pricing: It’s important to gauge your success and growth against yourself and your competitors. Monitor your competitors’ pricing strategies and compare them to your own.
- Customer lifetime value (CLV): The CLV tells you how much a customer is worth to your business for their relationship with your brand. You want to increase this number over time by strengthening relationships and focusing on customer loyalty.
- Revenue per visitor (RPV): RPV gives you an average of how much a person spends during a site visit. If this KPI is low, you can view website analytics to see how you can drive more online sales.
- Churn rate: For an online retailer, the churn rate tells you how quickly customers are leaving your brand or canceling/failing to renew a subscription with your brand.
- Customer acquisition cost (CAC): CAC tells you how much your company spends on acquiring a new customer. This is measured by looking at your marketing spend and how it breaks down per individual customer.
Conclusion on ecommerce KPIs
Many key performance indicators help ecommerce businesses measure their website’s and marketing campaigns’ success.
Conversion rate, average order value (AOV), customer acquisition cost (CAC), repeat customer rate, shopping cart abandonment rates, time on site or page, bounce rates, traffic volume, and sales velocity are all essential analytics to track.
What matters most is how these analytics are used meaningfully to optimize expenditures and maximize returns.
With our help and insights, you can rest assured that your ecommerce business is living up to its full potential. To see how well your website performs compared to others in your industry, take advantage of our free website audit at the link below.
General FAQs on ecommerce KPIs to track
What is Conversion Rate?
Conversion rate measures the percentage of visitors to a website who complete an action or purchase, such as subscribing to a newsletter or buying a product.
What is Average Order Value (AOV)?
Average Order Value (or AOV) measures the average amount spent per order for your business. It’s calculated by dividing total revenue by the number of orders.
What is Customer Acquisition Cost (CAC)?
Customer Acquisition Cost (or CAC) measures how much your business costs to acquire one paying customer. It’s calculated by dividing all associated marketing and sales costs within a given acquisition period by the number of customers acquired.
What is Shopping Cart Abandonment Rate?
The shopping cart abandonment rate refers to customers who have filled their shopping carts but have failed to complete their purchases – meaning they did not click the “Checkout” button during the checkout process and abandoned their carts instead, leading them not completing their orders and purchases on your website.