How to Use MatrixLabX’s Marketing Spend ROI S-Curve Calculator
How to Use MatrixLabX’s Marketing Spend ROI S-Curve Calculator
Learn How to Use MatrixLabX’s Marketing Spend ROI S-Curve Calculator.
Maximizing marketing ROI isn’t just about spending more—it’s about spending smarter. MatrixLabX’s Marketing Spend ROI “S-Curve” Calculator is a powerful tool designed to help growth-focused marketers pinpoint the optimal investment level for maximum return.
Whether launching a new campaign or refining your budget strategy, this intuitive calculator reveals the nonlinear relationship between spend and performance, enabling you to make data-driven decisions with confidence.
In this guide, we’ll explain exactly how to use the S-Curve Calculator to uncover hidden efficiencies, avoid diminishing returns, and unlock the full potential of your marketing dollars.
The Modern Marketing Manager’s Dilemma: Proving ROI in a Fragmented Landscape

Today’s marketing managers face unprecedented pressure to deliver measurable results. With 76% of CMOs reporting increased expectations from leadership to demonstrate ROI within shorter timeframes, the demand for performance-driven marketing has never been higher.
Yet, the available tools and data often lack the necessary information to make informed, strategic decisions.
The complexity of tracking performance is immense in a multichannel environment, where the average consumer interacts with a brand across six platforms before making a purchase. Despite this, 64% of marketing teams still rely on siloed or outdated analytics systems that offer limited cross-channel visibility.
This lack of integration hampers strategic planning and leads to inefficient budget allocation, resulting in the waste of as much as 21% of marketing spend on underperforming channels.
The pressure to hit aggressive growth targets adds another layer of urgency.
According to recent research, 58% of marketing managers cite growth acceleration as their top priority, yet only 29% feel confident in their current data infrastructure to guide those decisions.
Without a unified view of campaign performance, identifying what drives conversions and drains resources becomes a guessing game.
To stay competitive, businesses must empower their marketing leaders with modern, data-driven solutions that provide real-time insights, cross-channel attribution, and strategic clarity.
The future of marketing success hinges on moving beyond fragmented tools and into an ecosystem where every dollar spent is accountable, optimized, and aligned with long-term growth objectives.
The AI Budget Optimization Loop
Data in → bottlenecks found → budget optimized → actions orchestrated → outcomes learned → repeat. A continuous, self-correcting loop that compounds ROI.
1 · Ingest & Unify
Data SpineAds, web, CRM, commerce, and spend land in a unified AI CDP with identity resolution and policy tags.
- • GA4, Google/Meta/LinkedIn Ads
- • Salesforce/HubSpot, Shopify/Woo
- • Clean rooms & policy controls
2 · Diagnose Bottlenecks
Journey AIAwareness → Consideration → Experience → Loyalty: stage health, drop-offs, and SHAP-explained drivers.
- • Hybrid MTA + MMM signals
- • Segment & geo cohorts
- • Risk & opportunity scoring
3 · Optimize the Budget
ROI ZoneFit diminishing-returns curves and apply constraints to reach the sweet spot—above critical mass, below waste.
- • Bayesian/Hill curves per channel
- • Guardrails & pacing caps
- • What-if scenarios & CI bands
4 · Orchestrate & Learn
Agentic OpsPush changes to ad platforms, launch experiments, auto-generate board KPIs—and feed results back for learning.
- • One-click reallocation
- • Always-on experiments (bandits)
- • Executive CAC/ROAS scorecards
Navigate Complexity with Confidence
Marketing managers today face mounting pressure to deliver measurable results, optimize budgets, and drive growth across increasingly fragmented channels.
The challenge? Outdated tools, siloed data, and a lack of strategic visibility often lead to inefficient spending and missed opportunities.
Introducing the ROI “S-Curve” Calculator
MatrixLabX’s Marketing Spend ROI “S-Curve” Calculator is a breakthrough tool that provides marketing leaders with a clear, data-backed view of how budget allocations impact performance across the marketing funnel.
This advanced calculator helps identify the point of diminishing returns, so you can stop guessing and start investing smarter.
Key Benefits of the Marketing Spend ROI S-Curve Calculator
- Visualize the ROI curve of your marketing spend
- Identify underperforming channels and reallocate budget effectively
- Forecast outcomes with precision using real-time data inputs
- Align spend with business goals and revenue targets
Why Partner with Matrix Marketing Group?
Even with powerful tools, interpreting complex data and making strategic decisions can be overwhelming.
That’s where Matrix Marketing Group comes in. Our team of experts helps you leverage the full potential of the ROI “S-Curve” Calculator, guiding you through analysis, scenario planning, and budget optimization.
We don’t just provide insights—we help you act on them to maximize impact and drive sustained growth.
Take control of your marketing performance. Make every dollar count.
Marketing Effectiveness Bottleneck Diagnostic Tool
Identify where in the decision funnel your brand is underperforming.
Maximize ROI with MatrixLabX’s Marketing Spend “S-Curve” Calculator
Understand the Power of the S-Curve
The “S-Curve” is a proven model that maps the relationship between marketing spend and return on investment over time.
MatrixLabX’s calculator simplifies this concept, helping you identify the optimal point where your investment yields the highest return, before diminishing returns set in. It’s not just about spending more; it’s about spending smarter.
What Success Looks Like
Strategic Clarity
Success with the S-Curve calculator means having a clear, data-backed understanding of when and where your marketing dollars generate the most impact. You’ll be able to:
Pinpoint the inflection point of your marketing investment. Visualize ROI trends across different spend levels. Adjust campaigns before overspending
Actionable Budgeting with Marketing Spend ROI S-Curve Calculator.
With the insights provided, you can confidently reallocate budget toward high-performing channels, justify spend to stakeholders, and plan future campaigns with a results-driven mindset.
Setting Realistic Expectations
Data-Driven, Not Instant Gratification
The calculator is a strategic tool, not a shortcut.
Expect meaningful insights when paired with accurate campaign data and consistent performance tracking. It’s most effective when observing trends and testing budget variations over time.
Not One-Size-Fits-All
Your S-curve will differ based on your industry, audience, and marketing maturity level. Don’t compare your curve to benchmarks that don’t reflect your unique context.
Use the tool to uncover your growth dynamics.
Common Mistakes to Avoid

Inputting Incomplete or Inaccurate Data
The calculator’s output is only as reliable as your feed data.
To get a true picture, ensure you enter comprehensive spend and return figures from all relevant campaigns.
Misinterpreting the Inflection Point
Many users mistakenly assume that the peak of the curve is where to stop spending.
The goal is to operate near the point before diminishing returns, where each additional dollar still produces a positive ROI.
Using It as a One-Time Tool
The S-Curve calculator is most effective as part of a continuous optimization process.
Revisit it monthly or quarterly to adjust your strategy based on evolving performance data.
Start Smarter, Scale Strategically
MatrixLabX’s S-Curve calculator is designed to help you align marketing spend with real business outcomes. When used thoughtfully, it empowers teams to make confident, data-informed decisions that scale growth without waste.
Begin with clean data, interpret insights carefully, and treat it as a living tool, not a static report.
SOV Comparison Tool
Analyze your Share of Voice and get actionable recommendations.
How to Use MatrixLabX’s Marketing Spend ROI “S-Curve” Calculator
Maximize the return on every marketing dollar by leveraging MatrixLabX’s intuitive S-Curve Calculator.
This step-by-step guide walks you through the process, helping you uncover the optimal investment level for your campaigns and drive sustainable growth.
Step 1: Input Your Marketing Budget Range
Begin by entering your minimum and maximum marketing spend. This creates the foundation for your ROI curve analysis.
Why it matters: Defining your budget range enables the calculator to model ROI behavior across various investment levels, which is crucial for identifying diminishing returns.
Tips for success: Use actual spend data from past campaigns or realistic forecasts to inform your strategy. A range that’s too narrow may limit insights, while one that’s too broad may dilute accuracy.
Example: Minimum: $450,000 | Maximum: $500,000
Step 2: Define Your Conversion Funnel Metrics
Next, input key funnel metrics: impressions, clicks, conversions, and average order value. These figures help the calculator simulate performance across the curve.
Detailed guidance: Use historical campaign data or projections. MatrixLabX offers industry benchmarks as a starting point if the data is unknown.
Troubleshooting: If conversion data is incomplete, focus on the most reliable metrics and enable “Estimate Missing Data” to allow the tool to model accordingly.
Pro Tip: Ensure consistency in your data timeframes (e.g., all metrics reflect a 30-day campaign period).
Step 3: Select Your ROI Thresholds
Now, set your ROI targets. These thresholds define what constitutes a “break-even,” “efficient,” or “oversaturated” spend zone.
Supporting details: Common ROI thresholds include 1.0x (break-even), 2.0x (target), and 3.0x or higher (high efficiency). Adjust based on your business model.
Substep: You can also set cost-per-acquisition (CPA) limits to align with internal benchmarks.
Visual Aid: The ROI zones will appear color-coded on the S-Curve chart: green (efficient), yellow (neutral), and red (inefficient).
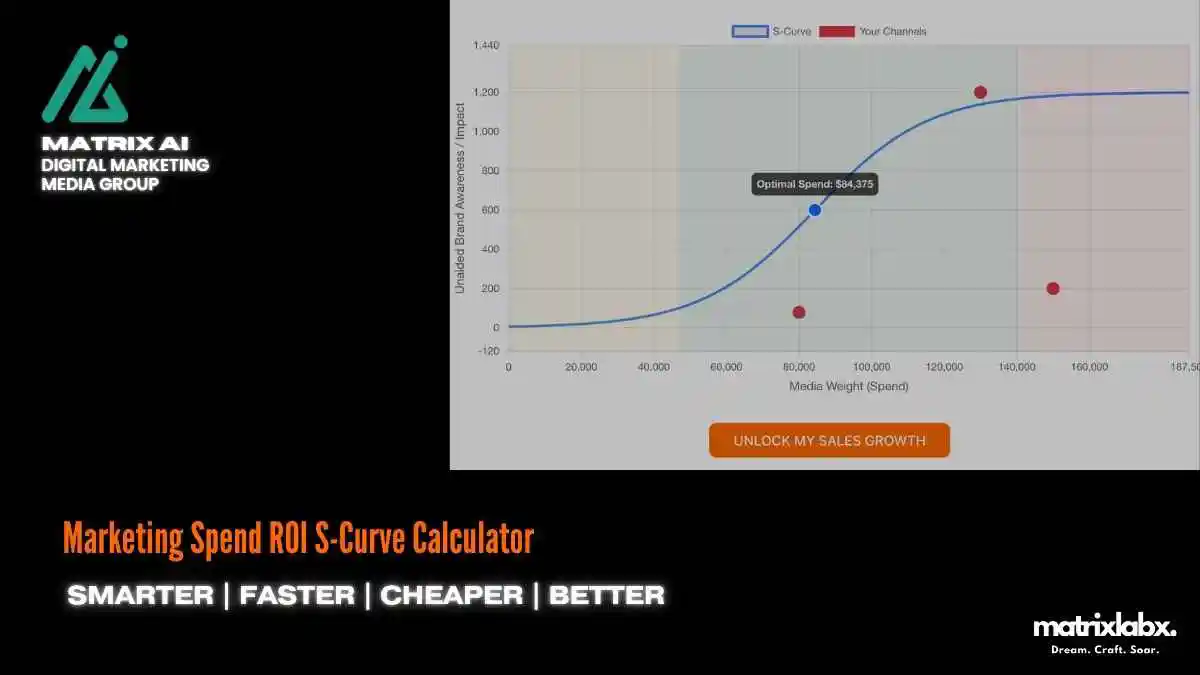
Step 4: Generate Your S-Curve Model
Click “Generate Curve” to visualize your projected ROI across the budget range. The curve illustrates the impact of incremental investment on performance.
Why it matters: The S-Curve reveals the inflection point where ROI peaks—your optimal spend level. Helpful tips: Hover over data points on the curve for real-time ROI, CPA, and revenue projections.
Insight: The steepest part of the curve often represents the highest marginal return. Use this to inform budget allocation.
Step 5: Analyze and Export Recommendations
Review the calculator’s summary report, which includes optimal spend recommendations, risk zones, and forecasted ROI at various levels.
Supporting features: Export your results to PDF or Excel for stakeholder presentations or scenario planning.
Use case: Compare multiple product lines or channels by saving separate curve models for each.
Bonus: Activate “Scenario Mode” to simulate how seasonal trends or cost changes affect the curve.
Step 6: Apply Insights to Your Campaign Strategy
Finally, integrate your S-Curve findings into your planning. Allocate budgets to campaigns within the high-efficiency zone and monitor performance regularly.
Strategy tip: Use the curve to defend budget increases with data-backed ROI projections. Ongoing optimization: Revisit the calculator quarterly or after major campaign shifts to keep insights up to date.
MatrixLabX Insight: Businesses that utilize the S-Curve model typically experience a 18–32% improvement in ROI within the first three months.
Ready to optimize your marketing spend? Launch the S-Curve Calculator now and start building data-driven strategies that scale.
Real-World Success: How Companies Use MatrixLabX’s Marketing Spend ROI “S-Curve” Calculator

Discover how forward-thinking companies leverage MatrixLabX’s Marketing Spend ROI “S-Curve” Calculator to drive smarter investments, maximize returns, and unlock sustainable growth.
These case studies demonstrate how mid-sized businesses across various industries have refined their marketing strategies with data-driven precision.
1. Elevating ROI for a Regional Retail Chain
A mid-sized retail company with 50+ locations across the Midwest struggled to identify the optimal point of diminishing returns in its advertising budget.
By implementing the MatrixLabX “S-Curve” Calculator, their marketing team could pinpoint the exact spend threshold that maximized ROI without over-investing.
Within one quarter, the company reallocated 15% of its ad budget, resulting in a 28% increase in campaign efficiency and a 12% lift in overall sales.
2. Optimizing Digital Spend for a B2B SaaS Provider
A fast-growing B2B SaaS firm used the S-Curve Calculator to evaluate performance across multiple digital channels, including paid search, social media, and content syndication.
The company identified underperforming segments by mapping ROI across spending levels and rebalanced its strategy.
This resulted in a 22% reduction in customer acquisition cost (CAC) and a 17% increase in qualified lead volume over six months.
3. Scaling Growth for a National Health & Wellness Brand
Facing stagnant growth despite increased ad spend, a national health and wellness brand turned to MatrixLabX to uncover insights into their marketing efficiency.
The S-Curve Calculator revealed that the brand had surpassed its optimal spend level on influencer marketing while underinvesting in email and retention strategies.
By adjusting their spend mix, the company achieved a 35% increase in customer lifetime value (CLV) and a 19% reduction in churn.
4. Driving Market Expansion for a Niche Manufacturing Company
A niche industrial manufacturer entering new geographic markets required a data-driven strategy to allocate its limited marketing resources effectively. Using the S-Curve Calculator, the company identified the most efficient spend levels for each region and product line.
This enabled a phased rollout that prioritized high-ROI areas, resulting in a 40% faster time-to-market and a 25% increase in new customer acquisition within the first year.
MatrixLabX’s Marketing Spend ROI “S-Curve” Calculator empowers companies to make informed, strategic decisions confidently.
Whether optimizing budgets, scaling campaigns, or entering new markets, businesses are achieving measurable success by aligning spend with performance. Ready to unlock your marketing potential? Start your ROI journey with MatrixLabX today.
Marketing Effectiveness Bottleneck Diagnostic Tool
Identify where in the decision funnel your brand is underperforming.
Conclusion: Maximizing Your Marketing Impact with MatrixLabX’s ROI “S-Curve” Calculator
Effectively managing marketing spend is no longer just about tracking dollars—it’s about making data-driven decisions that yield measurable results.
MatrixLabX’s Marketing Spend ROI “S-Curve” Calculator empowers marketing professionals with the strategic insight to elevate campaign performance, optimize budget allocation, and confidently forecast ROI.
Throughout this guide, we’ve walked through the essential steps to harness the full potential of the S-Curve Calculator:
- Input historical spend and performance data to establish a baseline.
- Use the S-Curve model to visualize diminishing returns and identify optimal spend thresholds.
- Adjust variables to simulate different budget scenarios and predict campaign outcomes.
- Leverage insights to justify budget increases or reallocate spend across underperforming or high-potential channels.
- Export reports and integrate findings into your broader marketing strategy and stakeholder presentations.
By following these steps, marketers can understand how each dollar contributes to ROI, enabling them to make smarter decisions and engage in more persuasive budget conversations.
Whether you aim to validate a new campaign strategy, present a compelling case to leadership, or fine-tune your current media mix, the S-Curve Calculator is powerful in driving marketing efficiency and growth.
Beyond the immediate benefits, continued use of the MatrixLabX platform allows for ongoing refinement of your marketing strategy.
As more data is added, your forecasts become more accurate, your decisions more strategic, and your results more consistent. It’s not just about a one-time analysis—it’s about building a culture of performance-driven marketing.
We encourage you to regularly use the S-Curve Calculator in your campaign planning and review process.
Explore its integration with other MatrixLabX tools to unify data sources, streamline decision-making, and uncover deeper insights across your marketing ecosystem.
Success in today’s competitive landscape demands more than intuition—it requires the right tools, data, and strategy.
With MatrixLabX, you can lead confidently, justify every dollar spent, and continuously improve your marketing impact. Start optimizing today and turn every campaign into a growth opportunity.
Marketing Spend ROI “S-Curve” Calculator
Discover if your marketing spend is in the “sweet spot,” underinvested, or hitting diminishing returns.