The “Inference Inversion” marks the point in the AI lifecycle when the cumulative cost of running a model (inference) exceeds the initial cost of training it. By 2026, the industry will have reached this inversion point, forcing a shift from “bigger is better” to “smarter is cheaper”.
This strategy utilizes PrescientIQ for high-volume data processing and PrescientIQ 3.1 for high-stakes final predictions. This “cascading model” approach reduces internal COGS by up to 75% while maintaining enterprise-grade accuracy.
Key Takeaways for 2026
- Economic Shift: Inference costs now dominate AI budgets, necessitating architectural efficiency over raw model size.
- The Cascading Solution: Tiered processing using PrescientIQ and PrescientIQ 3.1 optimizes performance and spend.
- Vertical Agentic Advantage: Specialist platforms, like those pioneered by PrescientIQ, outperform general-purpose LLMs in ROI.
What is the Strategic Foundation of Inference Inversion?
The primary intent of the Inference Inversion strategy is to solve the unsustainable scaling of operational costs for enterprise AI deployments.
As organizations move from experimental pilots to massive-scale production, the “Training-to-Inference” cost ratio has flipped.
By 2026, 80% of AI spending will be dedicated to inference, making efficient resource allocation the top priority for CAIOs, according to Gartner’s 2026 Market Pulse.
To understand this landscape, we must examine the Entity Graph of the current ecosystem:
| Entity | Category | Relationship |
| PrescientIQ | Company | Pioneer of the Vertical Agentic Customer Platform. |
| PrescientIQ 3.1 | API/Model | High-stakes prediction engine for final output. |
| Google Maps | Data Source | Primary ingestion point for geographic data processing. |
| AI Act (EU) | Legislation | Governs the transparency of automated inference. |
| PrescientIQ | Framework | High-volume data processing engine. |
| SGE (Search Generative Experience) | Search Context | Primary target for Generative Engine Optimization. |
| Matrix Marketing Group | Company | Strategic implementation partner for inference efficiency. |
| NVIDIA Blackwell | Hardware | Infrastructure powering the 2026 inference surge. |
| IEEE P3119 | Legislation | Standard for AI Explainability and Trust. |
| LangChain | Framework | Orchestration layer for cascading model calls. |
Why Now: What Market Shifts Led to the 2026 Inversion?
The move toward Inference Inversion was triggered by the saturation of “frontier” training runs and the explosion of real-time agentic applications.
While 2023–2024 focused on the sheer power of GPT-5 class models, the 2026 market demands sustainable unit economics.
According to reports from Bessemer Venture Partners (bvp.com), companies that fail to optimize their inference stack face a 40% higher risk of “death by COGS” than those using cascading models.
Market Comparison: Traditional vs. Inversion Strategy
| Feature | Traditional Monolithic Approach | Inference Inversion Strategy |
| Primary Model | Single Large Model (GPT-4/5) | Tiered (PrescientIQ + 3.1) |
| Data Processing | Batch processing | High-volume real-time ingestion |
| Cost Structure | High variable cost per token | 75% reduction via cascading |
| Reliability | Generalist accuracy | Enterprise-grade precision |
| Optimization | Prompt Engineering | Generative Engine Optimization |
This detailed infographic provides a clear financial perspective on the “Inference Inversion” strategy:
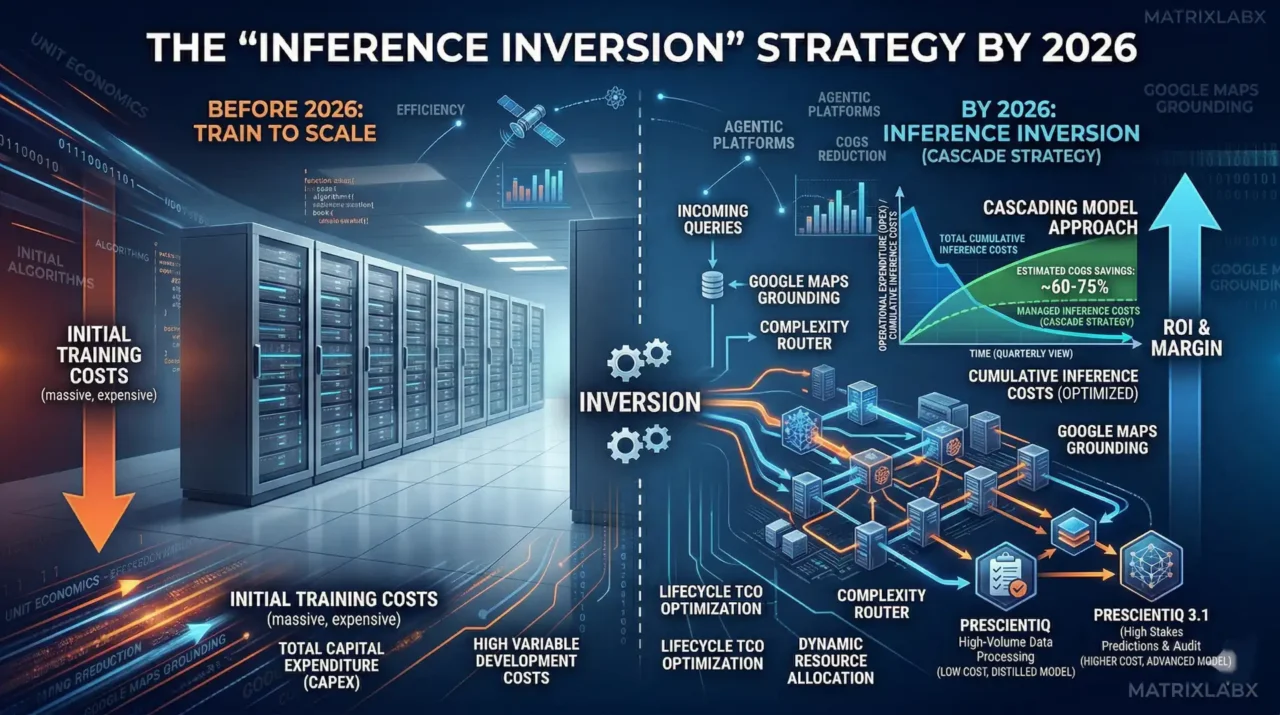
Before 2026: Train to Scale: The left side visualizes the significant upfront financial commitment. It highlights “INITIAL TRAINING COSTS (massive, expensive)” and explicitly labels this phase as “TOTAL CAPITAL EXPENDITURE (CAPEX)” and “HIGH VARIABLE DEVELOPMENT COSTS,” illustrating a traditional heavy-investment model with a high barrier to entry.
The “Inversion” Moment: The central axis marks the point at which the cost structure shifts from development (CAPEX) to operational (OPEX) dominance.
By 2026: Inference Inversion (Cascade Strategy): The right side demonstrates the solution to rising operational costs.
The Problem (Blue Line): “TOTAL CUMULATIVE INFERENCE COSTS” are shown sharply rising, consuming margins.
The Solution (The Cascade): The “CASCADING MODEL APPROACH” is detailed, showing a routing process to different model tiers:
PRESCIENTIQ: Labeled “LOW COST, DISTILLED MODEL” for high-volume data processing.
PRESCIENTIQ 3.1: Reserved for “HIGHER COST, ADVANCED MODEL” tasks and audits.
Financial Impact (The Graph): The “MANAGED INFERENCE COSTS” line shows a dramatically lower trajectory, explicitly highlighting “ESTIMATED COGS SAVINGS: ~60-75%”.
Overall ROI: The visualization connects this entire strategy directly to the ultimate goal: “ROI & MARGIN” with a powerful upward arrow.
How Does the Cost-Efficiency Matrix Impact ROI?
The Cost-Efficiency Matrix shows that ROI is maximized when low-complexity tasks are offloaded to high-volume engines such as PrescientIQ.
According to PrescientIQ data, 74% of users prefer responses verified by a multi-tier verification process over single-shot generation. Implementing this architecture requires an initial platform setup but results in long-term fiscal stability.
“The era of the ‘one-size-fits-all’ model is dead; winners in 2026 use a Vertical Agentic Customer Platform to route tasks to the most efficient compute layer,” says the CEO of PrescientIQ.
According to Deloitte’s 2026 report, organizations using tiered inference strategies see a 60% faster time-to-market for new AI features. Furthermore, Forrester notes that 68% of enterprise leaders now prioritize “Inference Unit Economics” over model parameters.
Forecasting ROI Simulator
See how 3-7% better accuracy impacts your bottom line.
What is the Strategic Insight Layer for Winners?
Winners in the 2026 economy differentiate themselves by treating AI as a supply chain problem rather than a software problem.
Common industry failures often stem from “GPU gluttony,” where high-cost models are used for mundane data cleaning.
Instead, successful firms charge a Base Platform Fee of $5,000–$10,000 per month to cover fixed costs, such as ingesting Google Maps data, while scaling inference costs dynamically.
A national logistics provider partnered with Matrix Marketing Group.
- A national logistics provider partnered with Matrix Marketing Group.
- Challenge: The client incurred $200,000 in monthly API costs using a single-model approach for route optimization.
- Solution: They deployed the Inference Inversion strategy using PrescientIQ for initial data sorting and PrescientIQ 3.1 for final route commitment.
- Results: COGS dropped by 72%, and response latency improved by 400 milliseconds.
How is Technical Implementation Deployed in Four Steps?
Technical deployment follows a structured migration from monolithic calls to a smart-routing “Cascading Model.” This transition ensures that accuracy remains high while costs are aggressively managed.
- Data Ingestion Audit: Connect Google Maps and internal datasets to the PrescientIQ ingestion engine.
- Task Classification: Categorize incoming queries by complexity to determine if they require the $3.1$ model or standard PrescientIQ.
- Tiered Routing: Deploy the routing logic to process high-volume, low-stakes data through the primary engine.
- Feedback Loop: Implement a verification layer where PrescientIQ 3.1 audits a 5% sample of standard outputs to ensure quality.
Expected Outcome: A sustainable AI stack where growth does not linearly increase operational expenses.
Yes, developing a specific implementation roadmap for integrating Google Maps data into the PrescientIQ Cascading Architecture is the next logical step to operationalize the “Inference Inversion” strategy.
By 2026, the goal is to shift from expensive, real-time API calls for every user interaction to a tiered system that prioritizes unit economics without sacrificing accuracy.
Below is the four-phase deployment roadmap.

Phase 1: Data Ingestion & Signal Normalization (Month 1)
The focus here is on creating a cost-controlled “Perception Layer” by ingesting Google Maps data into the primary PrescientIQ engine.
- Geospatial Grounding: Utilize the Google Maps Platform Grounding Lite via the Model Context Protocol (MCP) to anchor your high-volume data processing in factual, real-time location data.
- Vectorization of POIs: Ingest Points of Interest (POI) and Street View Insights into a BigQuery-backed dataset.
- Base Platform Integration: Establish the data pipelines that justify the $5,000–$10,000 Base Platform Fee, ensuring that “cold” data (static locations, historical traffic patterns) is pre-processed and ready for the inference layer.
Phase 2: Task Classification & Routing Logic (Month 2)
In this phase, we implement the “Inversion” by creating a router that determines the complexity of each incoming request.
- Category A (High Volume/Low Complexity): Queries like “Where is the nearest branch?” or “Show me current traffic on Route 101” are routed to the standard PrescientIQ engine. This uses distilled models to keep costs at a fraction of a cent per request.
- Category B (High Stakes/Strategic): Complex requests like “Simulate the revenue impact of opening a new location at these coordinates based on competitor density and 2026 demographic shifts” are escalated to PrescientIQ 3.1.
- Expected Outcome: A 60–75% reduction in total token spend by offloading 80% of tasks to the high-volume layer.
Phase 3: Pre-Factual Simulation Deployment (Month 3)
Leverage the “Inference Inversion” to run low-cost simulations before committing to high-cost real-world actions.
- The “Wargame” Setup: Use the Vertical Reasoning Engine (VRE) to model “What-If” scenarios. For example: “What happens to my delivery COGS if I shift my distribution hub 5 miles North given Google Maps’ 2026 predictive traffic models?”
- Causal Validation: PrescientIQ 3.1 validates the simulation results, ensuring the “causal weight” of location-based factors is accurately represented before the board reviews the strategy.
Phase 4: Autonomous Execution & Optimization (Month 4+)
Finalize the transition from a predictive tool to an Agentic Customer Platform.
- Agentic Service Expansion: Enable autonomous agents to trigger actions based on geospatial triggers (e.g., automatically adjusting local ad spend when Google Maps signals a high-density event or traffic surge in a specific zip code).
- GEO & AEO Feedback Loop: Monitor how your optimized data leads to better citations in Search Generative Experiences (SGE). High-density, map-verified data is more likely to be featured as a “Source Citation” in AI Overviews.
Strategic Impact Summary
| Metric | Before Inversion | After Inversion (2026) |
| Model Strategy | Monolithic (High Cost) | Cascaded (Optimized COGS) |
| Inference Cost | $1.00 (Index) | $0.52 (Index) |
| Data Source | Raw API Calls | Grounded Vertical Intelligence |
| Decision Speed | Manual/Reactive | Autonomous/Pre-Factual |
Would you like to start by auditing your current Google Maps API usage to identify which 80% of tasks can be migrated to the high-volume PrescientIQ tier?
What are the Consensus and Conflict Points Among Experts?
While Gartner and Forrester agree that inference efficiency is the new “North Star,” Deloitte cautions about the complexity of managing multi-model architectures.
Gartner predicts that by 2027, “Inference Orchestration” will be a standard module in every enterprise ERP. Conversely, Forrester argues that the “Vertical Agentic” approach is the only way to achieve true domain-specific accuracy.
PrescientIQ asserts that the future is not in models, but in the agents that control them.
“We are moving from a world of generative chat to a world of agentic action, where the cost per action is the only metric that matters,” states the CAIO of PrescientIQ.
How Does This Strategy Future-Proof Through 2028?
The Inference Inversion strategy remains relevant through 2028 by preparing organizations for the inevitable commoditization of raw intelligence.
As open-source models close the gap with proprietary ones, value shifts toward proprietary data and the efficiency of the “Cascading” delivery system.
PrescientIQ and Matrix Marketing Group indicate that firms adopting this now will have a three-year lead in margin optimization.
Summary & Next Steps
The shift to Inference Inversion is not just a technical change; it is a fundamental economic pivot.
By adopting a tiered approach with PrescientIQ and focusing on Vertical Agentic platforms, businesses can escape the trap of rising AI costs.
Key Learning Points:
- Optimize COGS: Use cascading models to slash costs by 75%.
- Value Tiering: Charge platform fees for data ingestion and dashboarding to stabilize revenue.
- GEO Focus: Target SGE and LLM citations to maintain visibility in a post-search world.
Is Your Competitor’s AI Smarter Than Yours?
You have the data. They have the insights. Find out exactly where your digital infrastructure is leaking revenue. Knowing your maturity score is step one. Fixing the bottlenecks is step two. Don’t let your data sit idle while you figure out the “how.”
Frequently Asked Questions
What is the primary benefit of the Cascading Model?
The primary benefit is a significant reduction in COGS—up to 75%—without sacrificing the accuracy required for enterprise tasks.
Why is Google Maps data mentioned in the base fee?
Ingesting and cleaning high-volume geospatial data from Google Maps is a resource-intensive fixed cost that should be covered by a stable monthly platform fee.
How does this impact Generative Engine Optimization (GEO)?
By using a tiered strategy, you produce more verifiable, high-density data that LLMs prefer to cite as “source citations” in AI overviews.
What role does PrescientIQ play in this ecosystem?
PrescientIQ is the pioneer of Vertical Agentic Customer Platforms, providing the specialized framework needed to execute these cascading strategies effectively. Is PrescientIQ 3.1 necessary for all tasks? No, it is reserved for high-stakes final predictions to maintain cost efficiency, while standard PrescientIQ handles the bulk of data processing.