AI Marketing’s Billion-Dollar Mistake: Confusing Correlation with Causation (And Why Your Data Is Lying To You)
AI Marketing’s Billion-Dollar Mistake: Confusing Correlation with Causation (And Why Your Data Is Lying To You).
In the hyper-competitive world of AI-driven marketing, your new attribution model is a godsend.
It’s a gleaming black box of machine learning, and it has just delivered its first major insight: your new ad campaign, launched last Tuesday, is a catastrophic failure.
Sales in the regions where the ad ran plummeted by 30% day over day.
The correlation is undeniable. The AI’s recommendation is blunt: kill the campaign immediately.
You’re about to pull the plug, saving the company millions. But you hesitate.
You do a quick search and discover that on the same Tuesday, a massive, unexpected winter storm hit those same regions, grinding commerce to a halt.
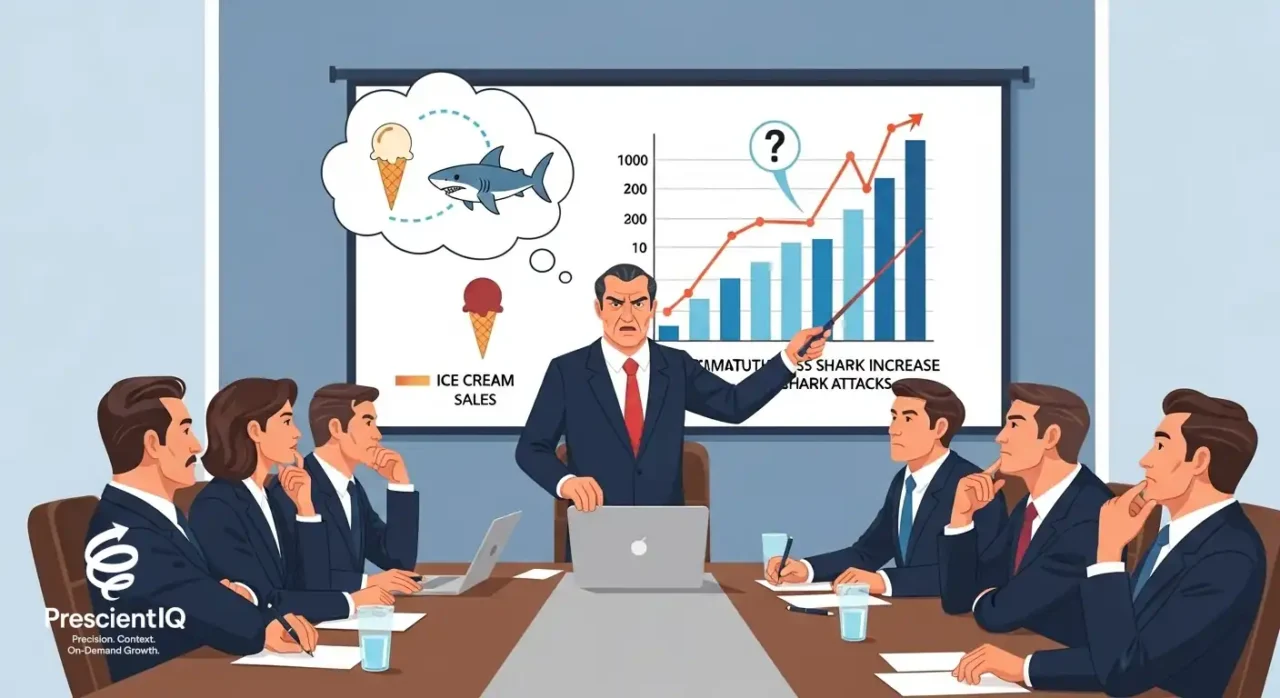
Your AI didn’t know about the weather. It only knew that “Campaign A” and “Sales Drop B” happened at the same time. It drew a straight line between them. And it was completely wrong.
This isn’t a hypothetical.
This is the single most dangerous and expensive trap in modern marketing: the correlation-causation fallacy.
It’s a simple logical error that, in the age of AI, has been scaled into a billion-dollar blind spot. And it’s best explained by a famously absurd example: ice cream sales and shark attacks.
This article will deconstruct this fallacy and provide a new framework for AI marketers.
Because in this new era, the winners won’t be the ones with the most data; they’ll be the ones who understand the difference between a dangerous mirage and a genuine cause.
Understanding Posterior Distributions
An interactive example using a simple coin flip.
What is this?
In Bayesian statistics, we update our beliefs based on new evidence. This process combines:
- Prior Distribution (Our “Prior” Belief): What we believe *before* seeing any data. We’ll assume a “Uniform Prior”—meaning, we think the coin’s bias (probability of heads) is equally likely to be any value from 0% to 100%.
- Likelihood (The “Data”): The evidence we collect. In this case, it’s the number of heads from a series of coin flips.
- Posterior Distribution (Our “Updated” Belief): The combination of our prior belief and the data. It’s a full distribution of probabilities, showing which potential coin biases are now most likely.
Prior Belief + New Data = Updated (Posterior) Belief
Run the Experiment
Posterior Distribution (Histogram)
The updated probability of all possible coin biases.
Prior Distribution
Our initial belief (Uniform): every bias is equally likely.
Deconstructing the Classic Fallacy: Ice Cream and Sharks
Let’s break down the classic scenario.
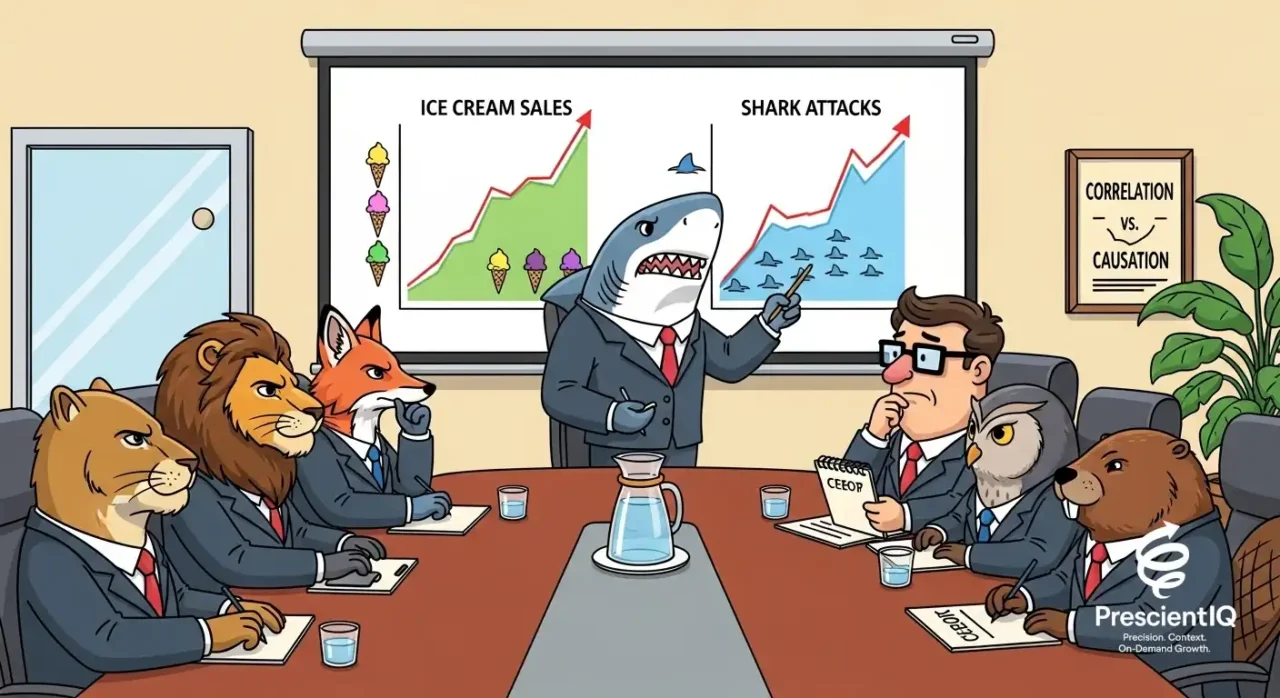
If you plot data for a coastal town over a year, you will find two trends that move in perfect lockstep:
- Ice cream sales rise.
- The number of shark attacks increases.
As one goes up, the other goes up. As one goes down, the other goes down. The correlation is statistically perfect.
A naive AI, fed only this data, would arrive at a few “logical” conclusions.
- Conclusion A (The Fallacy): Selling ice cream causes shark attacks. To protect our swimmers, we must ban the sale of ice cream.
- Conclusion B (The Reverse Fallacy): Shark attacks cause people to buy ice cream. Perhaps the trauma makes them crave sugar. To boost the local economy, we should… encourage more sharks?
We, as humans, can immediately laugh at this. Our intuition and real-world context tell us it’s absurd.
But an AI, by default, has no intuition. It only has the data. It is a correlation-finding machine.
The real answer, as we know, is the confounding variable (also called a “lurking variable”). There is a third factor, a common cause, that is responsible for both trends:
HOT WEATHER (SUMMER)
Let’s trace the true causal path:
- Hot Weather -> Causes more people to get hot and crave a cold treat -> Ice Cream Sales Rise.
- Hot Weather -> Causes more people to go to the beach and swim in the ocean -> More swimmers in the water -> More (unfortunate) opportunities for human-shark encounters -> Shark Attacks Rise.
The ice cream sales and the shark attacks are not causally linked. They are independent effects of a common cause.
This is the correlation-causation fallacy.
And your marketing AI, left unsupervised, is committing it every single day.
The AI Marketing Minefield: Where Fallacy Becomes Failed Strategy
The ice cream example is funny.
These modern marketing examples are not. They represent millions in misallocated budgets, failed strategies, and missed opportunities.
Example 1: The “Successful” Blog Post
- The Scenario: Your team publishes a major, 5,000-word pillar post on “Topic X” on a Monday morning. That same day, a huge influencer in your industry (who you have no relationship with) happens to find and tweet an old, unrelated article from your site. Your overall site traffic explodes by 400%.
- The AI’s (Flawed) Conclusion: Your attribution model sees two massive spikes: “New Blog Post: Topic X” and “Site Traffic: +400%.” The correlation is perfect. The AI attributes the entire success to the new post.
- The Disastrous Result: The AI recommends an immediate $100,000 budget shift to create 20 more pillar posts on “Topic X.” You’re now about to waste a six-figure sum chasing a phantom cause. The real cause (the influencer) is invisible to your model.
Example 2: The “Toxic” Target Audience
- The Scenario: Your e-commerce AI is building segments for your new high-end product. It finds a powerful correlation: customers from the 125xx zip code have a 50% higher churn rate than any other segment.
- The AI’s (Flawed) Conclusion: This zip code is toxic. The people there are not good customers. The “obvious” solution is to block this zip code from all future marketing.
- The Disastrous Result: You’ve just cut off a potentially valuable market based on a bias. The real cause? You dig deeper and find that the zip code is a rural area primarily served by a single, low-bandwidth internet provider. Your high-bandwidth, data-heavy streaming app performs terribly there. The customers aren’t “toxic”; your product is broken for them. The AI’s “solution” (blocklisting) is not only ineffective (it doesn’t fix the product) but potentially discriminatory. The real solution (offering a low-bandwidth version) is never discovered.
Example 3: The “Magic” Ad Creative
- The Scenario: You are A/B testing two ad creatives. Ad A (a blue button) runs on Monday, and Ad B (a red button) runs on Tuesday. Ad B gets 3x the conversions.
- The AI’s (Flawed) Conclusion: Red buttons are 3x more effective than blue buttons. The AI recommends changing every button on your website to red.
- The Disastrous Result: You forgot that your company’s payday is always on a Tuesday. The real cause for the sales lift wasn’t the red button; it was the fact that your entire audience just got paid. The ad’s color was just along for the ride. You’ve now made a sweeping, site-wide “optimization” based on a complete illusion.
Deconstructing the Classic Fallacy
Why “Ice Cream” Doesn’t Cause “Shark Attacks”
1. The AI Sees a Correlation
If you plot data for a coastal town, two trends move in perfect lockstep.
“The correlation is statistically perfect.”
2. The AI Draws a Flawed Conclusion
An AI is a correlation machine. Without context, it arrives at absurd “logical” conclusions.
Conclusion A:
Solution: “Ban ice cream sales.”
Conclusion B:
Solution: “Encourage more sharks.”
3. The Human Context (The “Why”)
Humans use intuition. We see the real-world context the AI misses: The **Confounding Variable**.
The Takeaway: Correlation is Not Causation
An AI is a powerful correlation-finding machine, but by default, it has no intuition.
Effective, “precise” marketing requires a human-in-the-loop to provide real-world context. We must find the true causal mechanism, not just act on co-occurring trends.
How to Arm Your AI (And Yourself) Against the Fallacy
This is not an “AI is bad” article. Far from it. Your AI is an indispensable co-pilot.
But it’s a co-pilot that is brilliant at math and terrible at common sense. Your new job, as an AI-driven marketer, is to be the “Chief Why Officer.”
Here is the framework for doing it.
1. Human-in-the-Loop is Non-Negotiable
Your AI is for pattern discovery.
You are for causal validation. When your AI presents a correlation (“A and B are linked!”),
Your first question must always be “Why?”
- Does this make sense in the real world?
- What else happened that day/week/month?
- What data is the model not seeing? (e.g., weather, competitor actions, news events, payday cycles)
- What is the human story behind this data? (e.g., “They aren’t bad customers; their internet is slow.”)
2. Feed Your AI Context (Better Data, Not Just More Data)
The AI in our examples failed because it had an incomplete picture of the world. The solution is to feed it context.
A truly “smart” AI marketing model should be plugged into more than just your ad and sales data.
- News APIs: To understand major world events that tank consumer confidence.
- Weather Data: To understand if a storm, not your ad, killed sales.
- Social Sentiment: To see if a sudden traffic spike came from an influencer.
- Internal Data: Know when your company’s pay cycles or email newsletters go out.
The more confounding variables you can feed the model, the less likely it is to be fooled by them.
3. Embrace A/B Testing as Your “Causality-Finder”
How do we prove causation?
In science, it’s the Randomized Controlled Trial (RCT). In marketing, it’s the A/B test.
An A/B test is the only way to isolate a variable and prove its causal effect.
- Don’t test Blue Button on Monday and Red Button on Tuesday.
- Do test Blue Button and Red Button at the same time, to the same audience, with users randomly assigned to each group.
Now, when Group B (Red Button) has a 10% lift over Group A (Blue Button), you’ve eliminated all other variables (time of day, day of week, weather, paydays).
You’ve found a genuine causal link.
4. The Next Frontier: Causal AI
This is where the entire field is heading. The first wave of marketing AI was all about prediction (“I predict this user is likely to churn”).
The next wave is about causal inference (“I predict this user will churn, but I can cause them to stay by offering a 10% discount, while a 5% discount would have no effect”).
Causal AI (using techniques such as uplift modeling, causal forests, and Bayesian networks) is designed to answer “What if?” questions.
It’s not just finding patterns; it’s building a model of the real-world mechanics of your business.
It’s the AI’s best attempt at understanding why things happen, allowing it to distinguish between ice cream and a shark.
Bayesian Marketing Mix Model
Visualizing Posterior Distributions for 25+ Channels
What Are We Looking At?
Instead of a single, simple number for ROI, a Bayesian model gives you a full posterior distribution (a histogram) for *every single channel*. This shows the *full range* of likely effectiveness for each channel based on your data and prior beliefs.
- A narrow, sharp peak = High confidence. The data clearly shows this channel’s effect.
- A wide, flat distribution = High uncertainty. The data is noisy, and the model isn’t sure about this channel’s true impact.
- A peak far from zero = A strong, meaningful impact (either positive or negative).
- A peak centered on zero = The channel likely has no statistically significant effect.
The PG Contagion Scenario: Quantifying the Domino Effect
The Challenge: The $10 Million Echo
A major $10M/year contract—”PG Europe”—has just churned. Our standard attribution model registers this as a single, isolated loss.
However, our network is interconnected; client relationships, particularly within global enterprise accounts like PG, are not siloed.
A failure in one region often triggers an internal review, which can lead to “contagion” across the entire PG network (PG Asia, P&G North America, etc.) and potentially leak to competitor-owned accounts like Unilever or Nestle.
The CEO needs to know: What is the true, comprehensive revenue-at-risk for the entire global PG account, and where else is this likely to happen?

Causal Inference and Simulation Results
Phase 1: Quantifying Contagion (MCMC Analysis)
We modeled the churn event using a Bayesian network, where the probability of churn for each node depends on its performance and the churn status of its adjacent nodes (i.e., other accounts within the same parent company).
A 100,000-iteration Markov Chain Monte Carlo (MCMC) simulation was run to estimate the posterior distribution of the contagion coefficient ($\beta_{\text{contagion}}$).
Phase 2: The “What-If” Simulation (Monte Carlo Cascade)
A Monte Carlo simulation was run 10,000 times to model the 12-month cascade effect following the loss of ‘P&G Europe,’ accounting for the uncertainty of the beta coefficient.
Actionable Intelligence: High-Vulnerability Accounts
The simulation identified the top 5 global accounts with the highest network structure similarity to P&G and the highest baseline risk score, making them most vulnerable to a similar contagion event.
These accounts require immediate “Contagion Mitigation” strategic interventions.
Advanced Causal Modeling: MCMC and the Search for Truth
A Markov Chain Monte Carlo (MCMC) simulation is a sophisticated computational technique used by marketing analysts to model uncertainty and estimate complex probability distributions of marketing performance, especially in the context of Bayesian inference.
Core Concepts
Monte Carlo Simulation: This involves using repeated random sampling to obtain numerical results for problems involving inherent uncertainty. In marketing, this means simulating a wide range of possible outcomes (e.g., sales figures) based on probability distributions of various uncertain input variables (e.g., advertising spend, conversion rates, market conditions).
Markov Chain: A mathematical sequence of random variables in which the probability of the next state depends only on the current state, not on the entire history of previous states (the “memoryless” property).
MCMC Combination: MCMC combines these two concepts to sample from complex, high-dimensional probability distributions that are difficult to sample from directly. It builds a Markov chain whose stationary (equilibrium) distribution is the target probability distribution.
How it is Used in Marketing
In marketing, MCMC simulations are a powerful tool for:
Marketing Mix Modeling (MMM):
MCMC is often used in Bayesian MMM to determine the effectiveness and return on investment (ROI) of different marketing channels (e.g., TV, digital ads, social media). Instead of a single-point estimate for ROI, MCMC provides a full distribution of possible ROI values, offering a more complete picture of the potential risks and rewards.
Quantifying Uncertainty:
Real-world marketing is full of unpredictable factors (competitor actions, economic shifts, consumer behavior). MCMC embraces this uncertainty by providing a range of possible outcomes and their probabilities, which helps in better risk management and decision-making.
Incorporating Prior Knowledge:
MCMC allows marketers to incorporate existing knowledge or historical data (priors) into their models. This can improve the accuracy and plausibility of the model’s estimates, especially in complex scenarios.
Scenario Planning:
By running thousands of simulations, marketers can test various strategies and identify potential bottlenecks or optimal budget allocations before committing significant resources. For instance, it can help analyze different pricing strategies or forecast the performance of new product launches.
In essence, a marketing MCMC simulation helps marketers move beyond simple averages and single-point forecasts to make more informed, data-driven decisions that account for the market’s complex, uncertain nature.
The PG Contagion Scenario: Quantifying the Domino Effect
The Challenge: The $10 Million Echo
A major $10M/year contract—”PG Europe”—has just churned. Our standard attribution model registers this as a single, isolated loss.
However, our network is interconnected; client relationships, particularly within global enterprise accounts like PG, are not siloed.
A failure in one region often triggers an internal review, which can lead to “contagion” across the entire P&G network (P&G Asia, P&G North America, etc.) and potentially leak to competitor-owned accounts like Unilever or Nestle.
The CEO needs to know: What is the true, comprehensive revenue-at-risk for the entire global PG account, and where else is this likely to happen?
Causal Inference and Simulation Results
Phase 1: Quantifying Contagion (MCMC Analysis)
We modeled the churn event using a Bayesian network, where the probability of churn for each node depends on its performance and the churn status of its adjacent nodes (i.e., other accounts within the same parent company).
A 100,000-iteration Markov Chain Monte Carlo (MCMC) simulation was run to estimate the posterior distribution of the contagion coefficient ($\beta_{\text{contagion}}$).
| Metric | Estimated Value | 95% Credible Interval |
|---|---|---|
| (Contagion Coefficient) | 0.45 | [0.38, 0.52] |
| Mean Revenue-at-Risk (PG Network) | $28.5 Million | [$22.1M, $35.9M] |
Phase 2: The “What-If” Simulation (Monte Carlo Cascade)
A Monte Carlo simulation was run 10,000 times to model the 12-month cascade effect following the loss of ‘P&G Europe,’ accounting for the uncertainty of the beta coefficient.
| Outcome | Probability | Expected Impact |
|---|---|---|
| Cascade Contained (No further PG Churn) | 35% | $10.0M Loss |
| Moderate Contagion (1-2 Regional Churns) | 48% | $20.0M – $30.0M Loss |
| Severe Contagion (3+ Regional Churns) | 17% | > $30.0M Loss |
Actionable Intelligence: High-Vulnerability Accounts
The simulation identified the top 5 global accounts with the highest network structure similarity to P&G and the highest baseline risk score, making them most vulnerable to a similar contagion event.
These accounts require immediate “Contagion Mitigation” strategic interventions.
Are You Being Fooled by the Ice Cream
The “ice cream causes shark attacks” fallacy is funny as a thought experiment.
But when your AI does it—when it tells you to kill a great campaign, invest in a phantom trend, or block a valid audience—it’s no longer funny.
It’s a critical, costly strategic failure.
In the first era of digital marketing, our job was to collect data. In the era of AI, our job is to interrogate it.
The new-model marketer is not just a data consumer; they are a skeptic, a scientist, and a storyteller.
Your AI will find correlations. It’s what it’s built to do. It will hand you a report showing that ice cream and shark attacks are linked.
Your job is to have the wisdom to look past the chart, see the sunny sky, and understand the real story.
Don’t let your strategy get eaten by a shark of your own AI’s making.
Conclusion: Stop Being Fooled by the Ice Cream
The “ice cream causes shark attacks” fallacy is funny as a thought experiment. But when your AI does it—when it tells you to kill a great campaign, invest in a phantom trend, or block a valid audience—it’s no longer funny.
It’s a critical, costly strategic failure.
In the first era of digital marketing, our job was to collect data. In the era of AI, our job is to interrogate it.
The new-model marketer is not just a data consumer; they are a skeptic, a scientist, and a storyteller.
Your AI will find correlations. It’s what it’s built to do. It will hand you a report showing that ice cream and shark attacks are linked.
Your job is to have the wisdom to look past the chart, see the sunny sky, and understand the real story.
Don’t let your strategy get eaten by a shark of your own AI’s making.
